
MARKET DASHBOARDS
The answer is in the dataDoes broadband penetration correlate to GDP per capita?
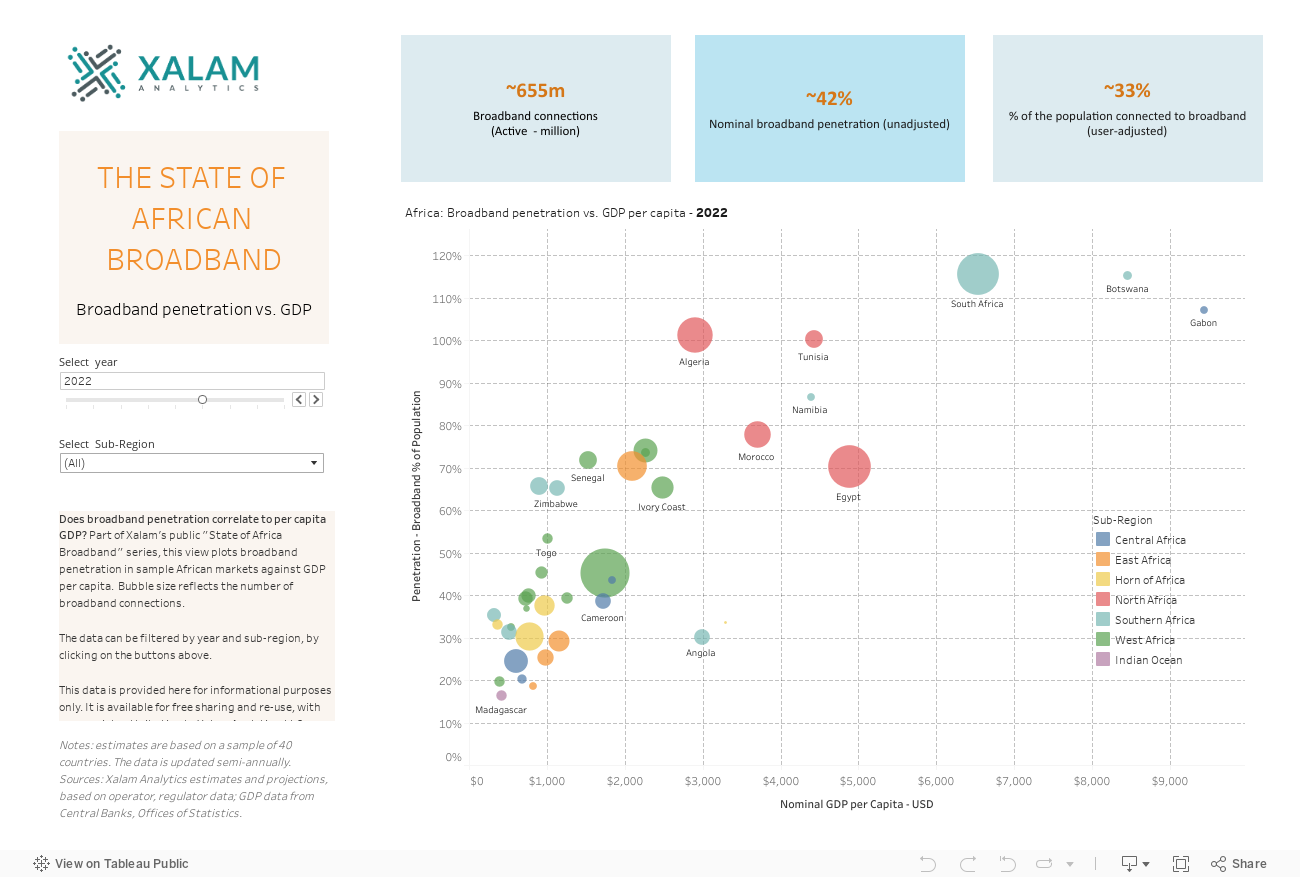
Does broadband penetration correlate to per capita GDP? Part of Xalam's public "State of Africa Broadband" series, this view plots broadband penetration in sample African markets against GDP per capita. Bubble size reflects the number of broadband connections.
Use as needed, check in often, and contact us at hello@xalamanalytics.com, with questions or feedback.
Our market dashboards are the result of extensive ground research and data collection work. We collect data from service providers, market regulators and other official sources. The data is then run through our forecast models for consistency and market projections. The data is refreshed as market projections are updated, and at least twice a year.
Yes. Our public data views represent only a small fraction of our market forecasts. Clients to the Xalam Market Dashboards get access to our full set of market dashboards, including thousands of data points and insights on broadband adoption, networks, traffic and usage, services revenue and more, all at country or service provider level. Please contact us at hello@xalamanalytics, should you have any interest in accessing the full set of market dashboards.
Mapping broadband: an interactive map view of broadband adoption and penetration in Africa.
What are the largest broadband markets in Africa? A Xalam ranking over the 2018-25 period.