
MARKET DASHBOARDS
The answer is in the dataTracking broadband adoption in Africa: market rankings
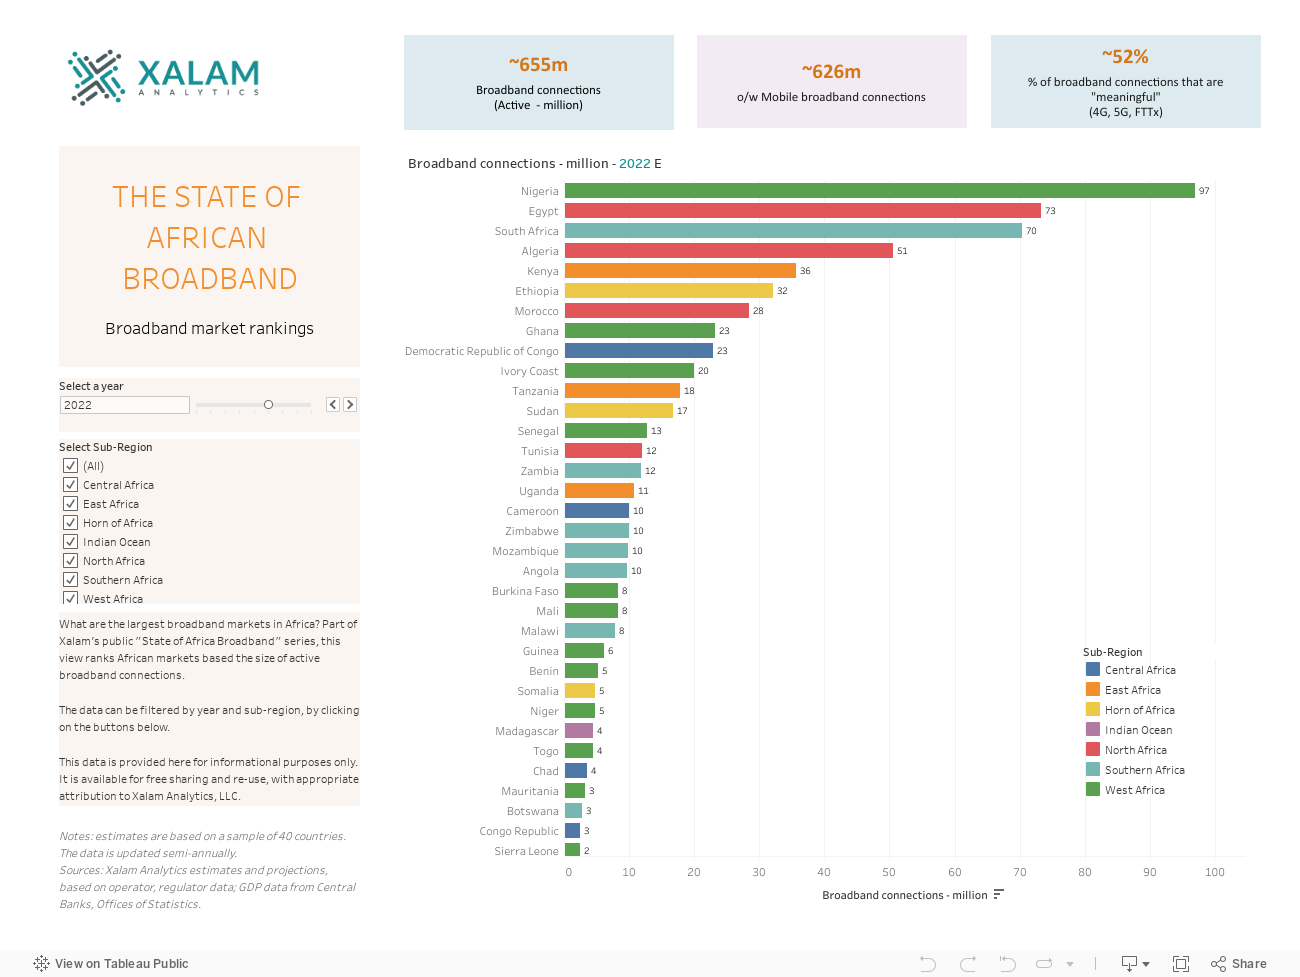
The African market is in the midst of a connectivity adoption boom. The number of broadband connections crossed the half-a-billion mark across the region in 2020. Despite these gains, Africa's digital inclusion gap remains considerable. At the end of 2022, nearly 70% of the population in the region was still not connected to the type of high-speed connection required for basic online video use.
To help track broadband adoption in the continent, Xalam is releasing for public access some of its client-only broadband market trackers. The views are part of Xalam’s “State of African Broadband” series, an extensive body of research including a broad range of indicators of adoption and usage across 40+ African countries.
Use as needed, check in often, and contact us at hello@xalamanalytics.com, with questions or feedback.
Mapping broadband: an interactive map view of broadband adoption and penetration in Africa.
Does broadband penetration correlate to per capita GDP? See the data views, and decide for yourself.