VISUALIZE THE DATA
Get the data. Visualize the patterns. Create your insights.
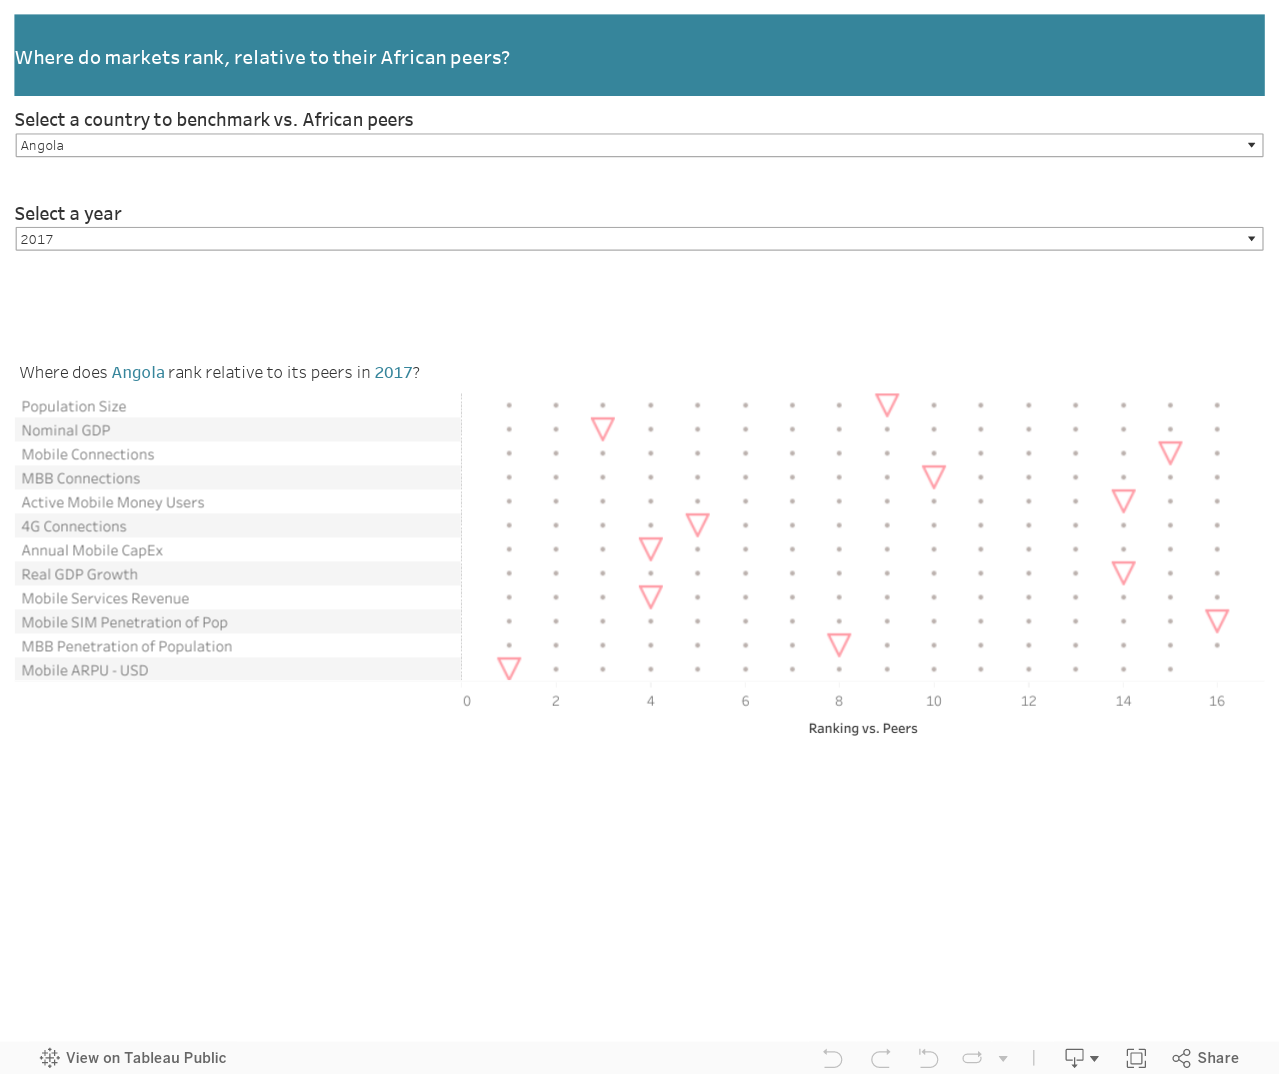
Sample visualization: How African markets rank relative to their peers
- This interactive table provides a ranking of 20 countries based on a 12 economic and ICT indicators. The user can play with the table to see the position of any of 13 selected markets in this sample.
- Rankings after 2017 are based on Xalam Analytics and IMF projections (for GDP growth data).
- Select a country and a year to get a summary view;
- The ranking table below will simultaneously adjust to show where the country ranks relative to its African peers.
- Hover the cursor over the marker to see the specific ranking.
Any questions? Feedback? Please send us a note at dashboards@wordpress-608563-1971338.cloudwaysapps.com.