
30+ Metros. 100+ providers. 150 facilities.
Africa Colocation Dashboards
Features Include:
Interactive data visualizations and maps; Filter, test, explore the data in new ways.
100+ colo providers in 30+ Metros.
Colo space, power, revenue projections.
Answer key questions in a few minutes.
Cloud-based; access anywhere you have good connectivity.
Starting at $625 / month.
($625 per month with annual plan)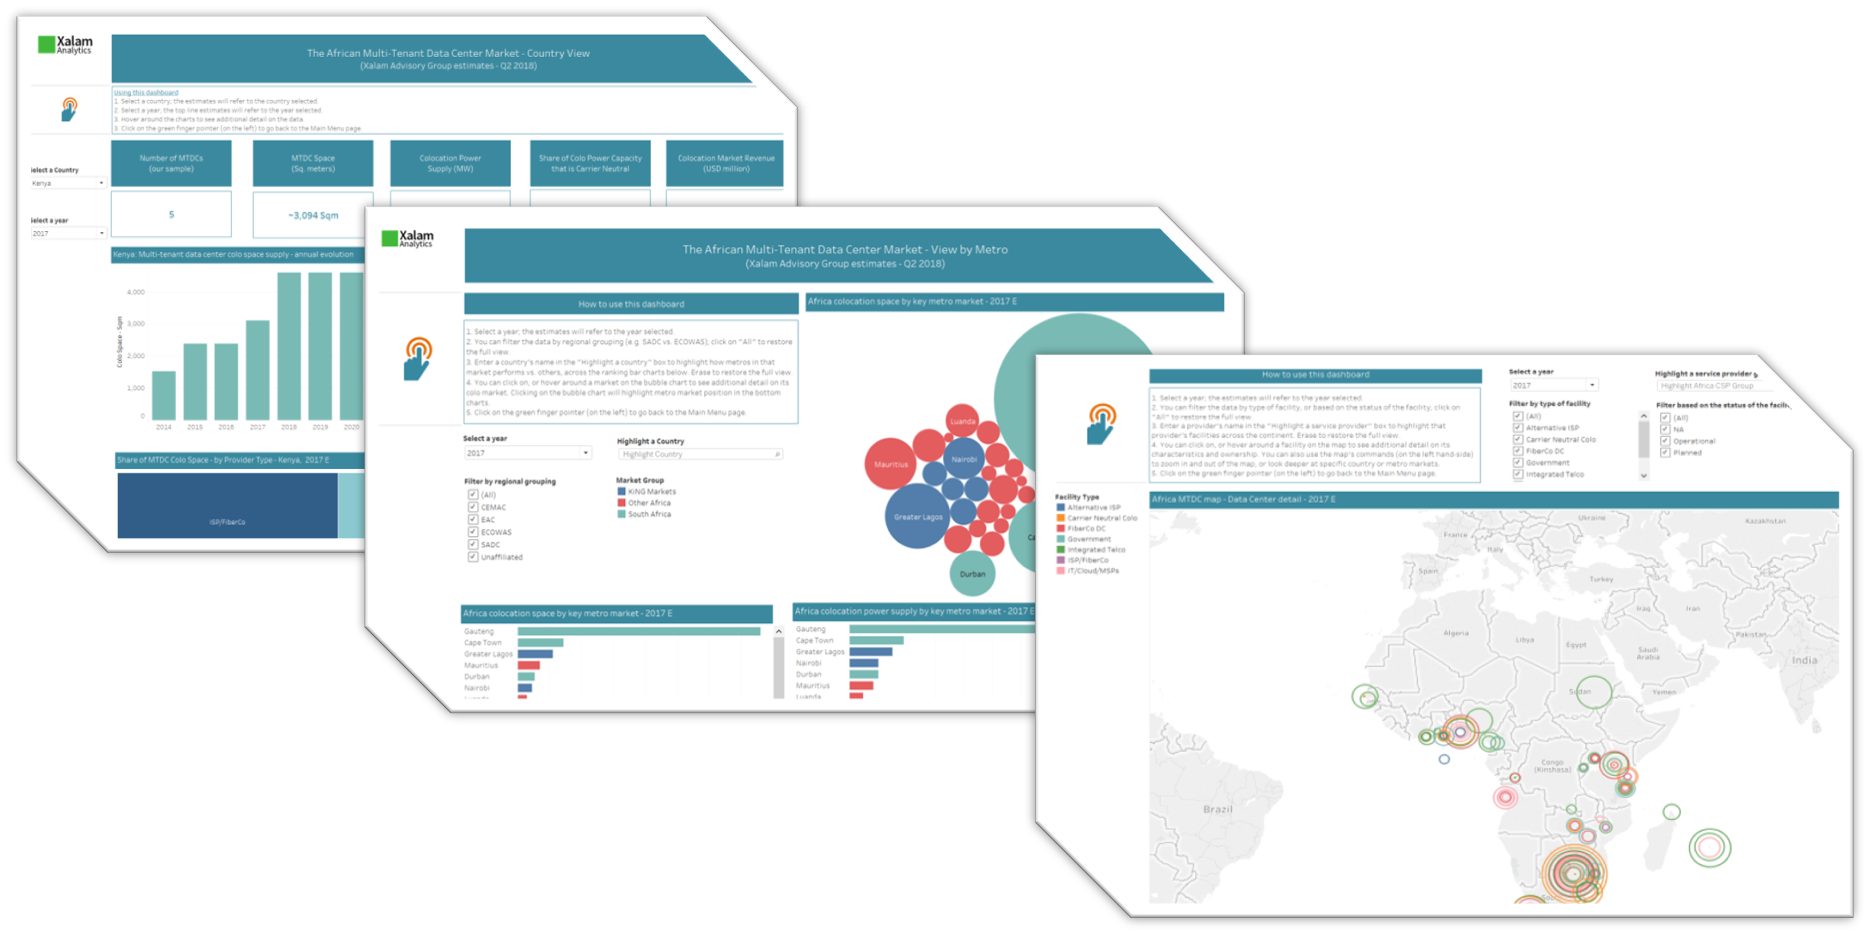
Monthly, annual, or full access
Flexible options to access the insights you need and maximize your budget.
Monthly Access
$1,250
30 days access1 User License
Access to all Colo Dashboards
Interact with the data; filter, adjust, zoom in/out and more
Download charts & views as PDF or PNG
Annual Access
$625
per month billed annually1 User license, valid one year
All components of Monthly Access
Download charts & views as PDF or PNG
Convert key data to Microsoft Excel!
Xalam Full Access
Contact Us
Save +50% off price list.1 User license, valid one year
All Annual Access components
Access to the complete Xalam Report library.
Access to all Xalam Wholesale Dashboards: International Wholesale, Colocation, Metro Fibre
For questions regarding our pricing plans above, don't hesitate to contact us!
Get your colo answers
You can already answer the questions below, and more. What is your question today?

Explore the big picture
How large is the African colo market – space, power, revenue? How fast is it growing? Which segments drive growth? How many carrier-neutral data centers are there, by sub-region (SADC, ECOWAS, etc.), market, metro, etc.
Do a market deep dive
Benchmark markets; what are the largest markets (space, power, revenue)? The revenue projections? Colo revenue structure by segment (connectivity, OTTs, financials, enterprise, etc.)? Key player market share, etc.
Assess DC providers
Assess providers and data center facilities; who are the largest holders of colo power and capacity? How much capacity do they have? What are their growth projections? Who owns a specific facility, etc.